
Definitions
Carbon accounting methodologies vary, but the widely used GHG protocol splits emissions into Scope 1, 2, and 3. Granular Energy enables energy suppliers to communicate on their clients' Scope 2 emissions, which covers indirect emissions from electricity procurement and usage.
The GHG protocol offers two ways to calculate Scope 2 emissions:
- Location-based
- Market-based
Location-based calculations measure the average emissions from the energy generation mix in a specific geographic area, ignoring traceability frameworks such as energy attribute certificates. This method is simple but may not accurately reflect an organisation's commitment to source renewable energy, as it disregards any specific attribution of clean energy sources to the consumer.
Market-based calculations rely on an attributional accounting approach, whereby generation from specific sources is assigned to a consumer based on its procurement strategy and preferences. This framework uses energy attribute certificates (GO/REC/iREC) to trace and map electrons across the grid. This method offers a more accurate reflection of an organisation's procurement choices.
In short, location-based emissions focus on regional averages, while market-based emissions account for an organisation's specific energy choices. The difference between the two approaches represents the impact of an organisation's active sourcing and sponsoring of renewable energy generation as compared to passively relying on the local electricity system setup.
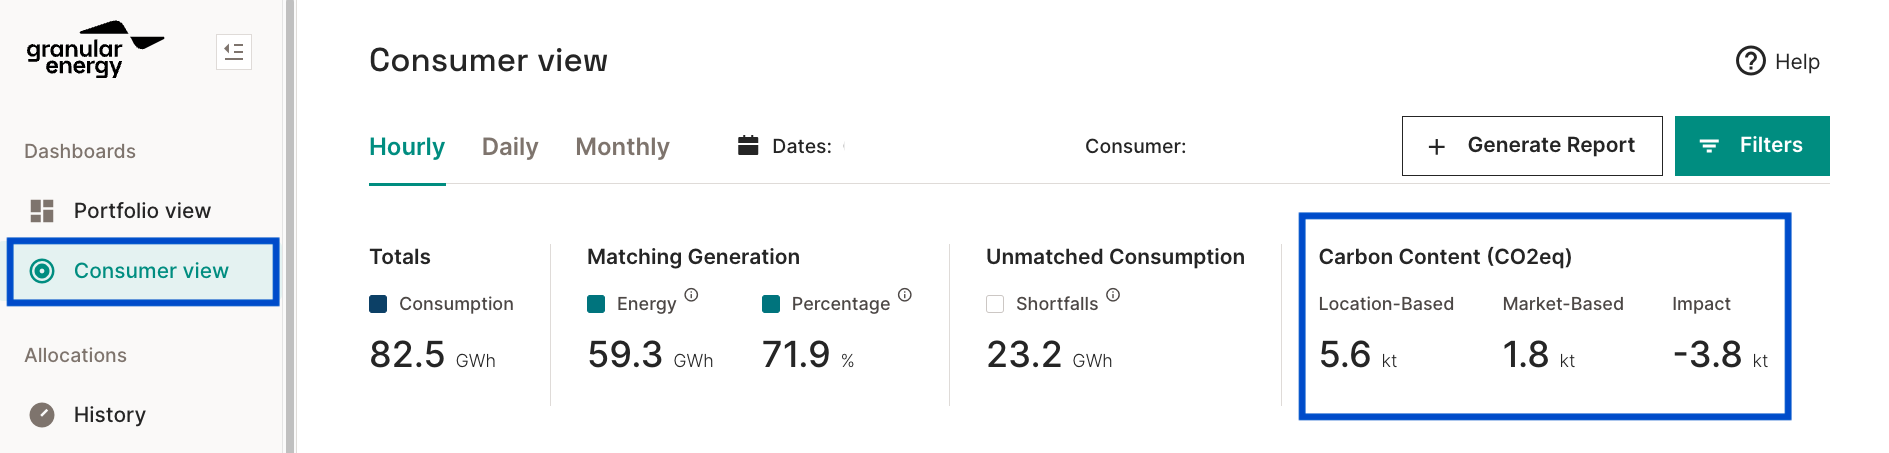
Granular Energy calculates emissions from both location-based and market-based approaches. You can find them displayed in the Consumer View dashboard or on the end-consumer reports generated in the platform.
Calculations
Overview:
Carbon emissions are quantified and reported for a specified consumption period, expressed in kilograms or tons of CO2.
For location-based calculations, emissions are determined by multiplying the local grid's average emission factor, provided by the Transmission System Operator, by the consumption amount.
Conversely, market-based calculations use the emission factors linked to certificates for the consumption portion covered by them, while employing the grid's average residual mix emission factor for the unmatched portion.
Location-based calculation details:
Using this method, emissions are determined by multiplying the total consumption by the average grid emission factor in the consumer's location. The formula is as follows:

The average grid emission factor, typically measured in gCO2/kWh, is calculated as a weighted average of individual emission factors for all production sources, based on their contributions to the overall production mix.
If the grid mix in the local area is as follows:
- 30% coal, with coal production yielding 1000 grams of C02 per kWh generated
- 20% gas, with gas production yielding 500 grams of C02 per kWh generated
- 50% wind, with wind production yielding 0 grams of C02 per kWh generated
The resulting average grid emission factor would equal 0.30*1000 + 0.20*500 + 0.50*0 = 400 gCO2/kWh.
Market-based calculation details:
This method first calculates the carbon emissions linked to the consumer's assigned production sources through energy attribute certificates. Generally, for renewables, these emissions amount to 0, as renewable sources generate no marginal CO2 emissions during production.
To account for the share of consumption not covered by energy attribute certificates, the most appropriate approach is to weigh it by the local grid's average emission factor, assuming it consists only of untracked energy sources. This is referred to as the "residual mix." This approach prevents double counting of renewable energy obtained through certificates and the natural renewable energy share in the local grid mix that has also been subject to certificate sale. The formula is as follows:

Where (denoting the generation technology by "s"):


When all certificates originate from carbon-free energy, that will simplify the formula as:

We can illustrate the calculation of the average grid residual mix emission factor on the example from the previous section. Assuming we have an original grid mix as follows:
- 30% coal, with coal production yielding 1000 grams of C02 per kWh generated
- 20% gas, with gas production yielding 500 grams of C02 per kWh generated
- 50% wind, with wind production yielding 0 grams of C02 per kWh generated:
- out of which 40% got issued certificates, which were sold (tracked)
- out of which 10% did not participate in any certificate system (untracked)
We assume that neither coal nor gas production was subject to tracking by a certificate system.
To calculate the residual mix, we would first calculate the "untracked" share of the mix, in that case, 0.30+0.20+0.10 = 0.60.
We would then calculate the contribution of each source in this total untracked grid output, to get the grid "residual mix":
- 50% coal (0.30 / 0.60)
- 33.33% gas
- 16.67% wind
The resulting average grid residual mix emission factor would equal 0.50*1000 + 0.33*500 + 0.17*0 = 666.67 gCO2/kWh.
It is important to observe that the residual mix's average emission factor typically exceeds that of the standard grid mix. This occurs because the "untracked" portion of the mix, predominantly utilized in this context, consists mainly of non-renewable sources.
Calculating emissions under different time definitions: a note on the granularity
In any metric calculation, it is crucial to specify the time definition used. Carbon emissions, like matching statistics, can vary depending on the data's sampling frequency (or time granularity). Although the industry has predominantly used annual averages to compute carbon emissions, this approach results in a biased estimate of actual emissions.
Hence, we advocate for hourly carbon emissions accounting, utilizing hourly measurements for both consumption and grid emission factors to accurately assess carbon impact.
Furthermore, our platform enables the comparison of these metrics across different time definitions, ranging from yearly to hourly, for the same specified measurement period.
Sources for the data used in the platform
Germany
For Germany, the carbon emissions data is hourly. The hourly grid mix data comes from Entso-E and technology-specific emissions factors come from Electricity Maps and Volker-Quasching. The hourly average grid emissions are calculated by multiplying the emissions factors by technology by the generated energy per technology and dividing by the total grid output for each hour. The hourly residual mix is calculated by taking the average hourly grid emissions and multiplying it by the ratio of the annual average grid mix (Entso-E) to the annual residual mix (AIB). The data is available from January 2020 to June 2023.
Italy
For Italy, the carbon emissions data is annual (hourly coming soon). The average grid emissions data comes from Entso-E. The residual mix grid comes from the AIB. The data covers January 2020 to June 2023, with the 2023 data based on 2022 emissions factors due to lack of data for 2023. The average/residual mix data is the annual data and remains constant throughout every hour of the year. Hourly calculations are coming soon...
UK
For the UK, the carbon emissions data is hourly, and is provided by National Grid ESO. The hourly residual mix is calculated by taking the average hourly grid emissions and multiplying it by the ratio of the annual average grid mix (National Grid ESO) to the annual residual mix (AIB). The data is available from January 2020 to June 2023.
US
For the US, the carbon emissions data is hourly, and is provided by Electricity Maps. The data is available from January 2022 up until the end of the previous calendar month. The standard (full) grid mix emission factors are used as proxy values for residual mix emissions, for now, as the approach for deriving residual mix in the US has yet to be defined. We are collaborating with other industry partners and stakeholders towards improving/establishing methodologies in this area.